

FSO
Full-Stack Observability Solutions.
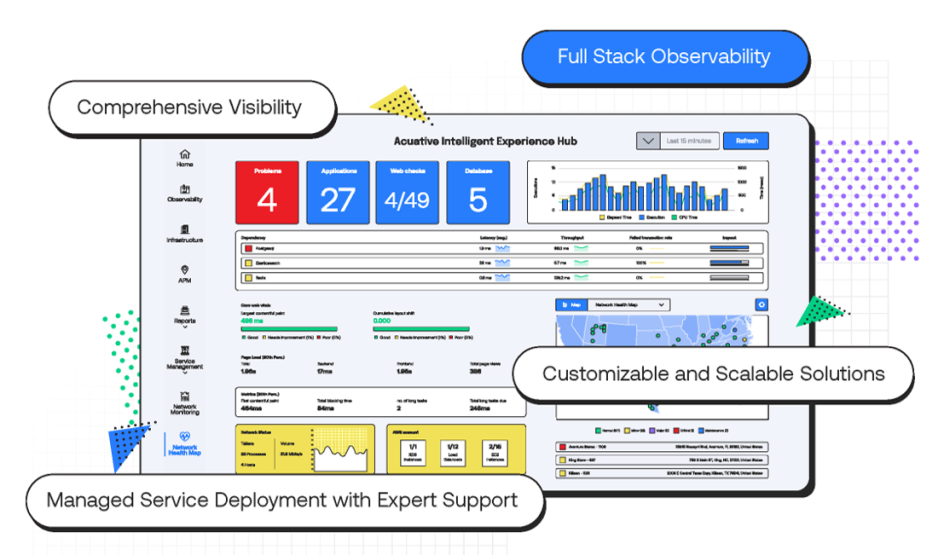
At Acuative, we deliver full-stack observability, ensuring complete visibility across your application stack—from end-user experience to infrastructure. Powered by Elastic Observability, our solution integrates Log Monitoring, Cloud and Infrastructure Monitoring, APM, Digital Experience Monitoring, and more for faster issue resolution and optimized performance.

FSO
Enhance Performance with Acuative’s Expertise
Whether you're new to observability or upgrading, our experts are here to help you unlock the full potential of your monitoring strategy. Contact us today to see how our observability solutions can elevate your business.
Solutions
Logs: Real-Time Monitoring
Solutions for Business Continuity
 Log Monitoring and Analytics
 Metrics Monitoring
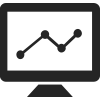 Open Telemetry
Logs
Log Monitoring and Analytics
Leverage the power of Log Monitoring and Analytics to gain deep insights into your system's behavior. By collecting and analyzing logs from various sources, you can detect anomalies, troubleshoot issues faster, and uncover trends that impact performance and security. This visibility is crucial for identifying the root cause of problems and maintaining a secure and efficient environment.
Logs
Metrics Monitoring
Track the health and performance of your applications and infrastructure with Metrics Monitoring. By continuously measuring key performance indicators like CPU usage, memory consumption, and network traffic, you can ensure that your systems are running optimally.
Logs
Open Telemetry
Leverage Open Telemetry to unify your observability strategy across distributed systems. As an open-source standard, Open Telemetry enables the collection of telemetry data—traces, metrics, and logs—from your entire stack. This comprehensive approach ensures consistent, scalable monitoring and helps you diagnose performance issues faster, improving operational efficiency and system reliability. This proactive approach helps in predicting potential issues and maintaining the reliability of your services.
Solutions
Application: Real-Time Monitoring
Solutions for Business Continuity
Solutions
Infastructure: Real-Time Monitoring
Solutions for Business Continuity
Infrastructure
Distributed Tracing
Distributed tracing provides end-to-end visibility into requests as they travel through complex, multi-service architectures, helping to pinpoint performance bottlenecks and troubleshoot issues faster. By tracking each request across microservices, databases, and third-party APIs, it enables deeper insights into system behavior and enhances overall observability.
Infrastructure
Universal Profiling
Optimize the performance of your applications with Universal Profiling. This technique continuously profiles your entire environment, from the CPU to memory usage, regardless of the language or framework in use. By identifying inefficiencies in real-time, universal profiling helps you improve application performance, reduce resource consumption, and enhance the overall efficiency of your infrastructure.
Our Services
Why Choose Full-Stack Observability?
Engineer, Deliver, Monitor: Crafting Your IT Future with Precision and Performance.

End-to-End Visibility Across Your Entire Tech Stack
Full-Stack Observability delivers comprehensive visibility into every aspect of your infrastructure—from front-end interfaces to back-end services and databases. By monitoring all layers, it enables you to quickly identify and address performance bottlenecks, minimizing downtime and enhancing the overall user experience.
Proactive Issue Detection and Swift Troubleshooting
With full-stack observability, you can spot anomalies and potential risks before they turn into critical incidents. By correlating data across all layers, it becomes easier to identify root causes, drastically reducing mean time to resolution (MTTR) and keeping your systems running smoothly.

Optimized Resource Utilization and Cost Efficiency
Full-Stack Observability offers real-time insights into resource usage, enabling you to make more efficient use of your infrastructure. This not only enhances performance but also reduces operational costs, providing a scalable solution that evolves with your business.
Solutions
Why Our Full-Stack Observability Solution Stands Out?
Our Full-Stack Observability solution provides complete visibility and monitoring across your entire IT environment, ensuring superior performance and scalability. By enhancing operational efficiency and optimizing system performance, we position your business for success, making us the ideal choice for all your observability needs.
![]()
Elite Partnership with Elastic
As the only Elastic Elite Partner in the Middle East, we are recognized for our expertise and dedication to delivering exceptional solutions across the region. This esteemed partnership allows us unique access to Elastic’s latest innovations and resources, empowering us to provide you with cutting-edge, reliable, and scalable observability solutions.
![]()
Comprehensive Monitoring Capabilities
Our solution provides a unified platform that covers every aspect of your IT environment—from infrastructure and application performance to real user monitoring, log analytics, and more. This holistic approach allows for seamless integration and comprehensive visibility across your entire stack.
![]()
Tailored Solutions for Your Needs
We understand that every business is unique, which is why we offer customizable observability solutions tailored to your specific requirements. Our team of experts will work closely with you to design and implement a monitoring strategy that aligns with your operational goals and business objectives.
![]()
Proven Expertise and Support
With our deep industry knowledge and a team of certified professionals, we offer best-in-class support and guidance throughout your observability journey. From deployment to optimization, we are dedicated to ensuring your systems are optimized for peak performance and maximum impact.

Faster Time to Value
Our full-stack observability solution is designed for rapid implementation and quick results. With real-time insights and advanced analytics, you can identify and resolve issues faster, reduce downtime, and enhance the overall efficiency of your operations.
Observability Solutions Designed to Match Your Business Requirements
Acuative offers customized observability solutions tailored to meet the unique needs and complexities of each business. Our approach ensures that every client receives a solution designed to optimize their specific environment, whether it involves monitoring, tracing, logging, or performance metrics. With our expert consultation services, we work closely with your team to understand your operational goals and challenges, crafting observability strategies that enhance system reliability and performance. From seamless integration to ongoing support, Acuative provides a holistic approach to observability, helping businesses maintain high availability, reduce downtime, and improve user experiences. Our personalized service ensures that each solution is scalable, efficient, and aligned with your business objectives, enabling you to harness the full potential of your technology investments.
solutions
Flexible Deployment Options for Observability Solutions
Scalable Observability Solutions with Flexible Deployment Choices

FSO
On-Premise Deployment
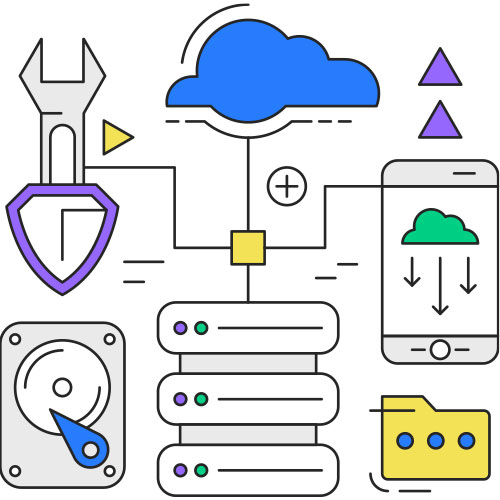
No matter which cloud you are using, our on premise deployment option seamlessly integrates our powerful observability solutions into your existing cloud environment, local infrastructure, or internal servers. This deployment option gives you unmatched control over your data while ensuring full compliance with security standards. Our expert team handles every step of the process, from initial setup to full implementation, providing ongoing support to optimize performance and maintain system reliability. Enhance your infrastructure with a tailored on premise solution designed to fit your specific business needs.

FSO
Acuative Managed Services
Our Managed Service Deployment offers a fully managed observability solution hosted on Acuative’s cloud powered by oracle. This service provides a scalable and secure observability platform without the need for client-managed infrastructure, allowing businesses to focus on core activities while we handle monitoring and performance management. With this option, clients enjoy reliable, expert-managed services that enhance system visibility and security.
solutions
Comprehensive Consultation Services for Full-Stack Observability
Acuative provides a wide range of consultation services designed to optimize your full-stack observability. From initial assessment to deployment and beyond, our expert team is here to support your journey toward a more visible, efficient, and secure infrastructure.
Assessment
We begin by conducting a thorough assessment of your current systems, data requirements, and business goals. This helps us understand your unique needs and develop a robust observability solution tailored to enhance your infrastructure's performance and reliability.
![]()
Design
Following the assessment, we create a custom observability design that perfectly aligns with your workload and data management needs. Our designs focus on maintaining optimal cluster health and performance, ensuring your systems are always operating at their best.
![]()
Personalized Package
Acuative offers personalized packages tailored to your specific observability needs. Whether you are in the early stages of deployment or looking to optimize an existing setup, our customizable packages provide the right level of expertise and support at every phase.
Migration and enhancement Solution
For clients looking to transition from older platforms or adopt the latest observability features, our structured migration and upgrade services help minimize risks and maximize benefits. We ensure a seamless transition that enhances your system's capabilities and performance.
![]()
Flexible Deployment Options: On-Premises or Managed Service
Acuative offers On-Premise Deployment for full data control within your infrastructure or a fully managed Cloud Service where Acuative handles setup and management, ensuring reliable performance.
![]()
Personalized Package
Throughout the development and implementation stages, our team provides continuous guidance and updates. By collaborating directly with your team, we ensure that your observability solution is deployed according to your current business needs, aligns with your operational goals, and enhances overall system performance.
Deployment Support
Whether you choose Acuative managed service or on-premises deployment, we provide full support throughout the deployment process. Our team ensures seamless integration and offers ongoing assistance 24/7 to maintain system integrity and optimal performance.
USE CASES
Embracing FSO: Pivotal Solutions for Retail
RETAIL
Full Stack Observability (FSO) empowers retailers to monitor every layer of their technology stack—from in-store devices and POS systems to cloud-based inventory and customer experience platforms. By providing real-time insights and end-to-end visibility, FSO helps retail IT teams proactively resolve issues, optimize performance, and deliver seamless shopping experiences across channels.
Explore our Retail FSO Playbook to see how this approach can transform operations, reduce downtime, and support smarter decision-making across your retail ecosystem.
Service Level Indicators (SLI)
Monitor and uphold your Service Level Objectives (SLOs) by keeping a close eye on Service Level Indicators (SLIs). These metrics reflect the reliability and performance of your service, providing critical insights into whether you're meeting customer expectations. Maintaining strong SLIs is essential for ensuring customer satisfaction and contractual obligations.
Uptime Monitoring
Ensure your services are always available with Uptime Monitoring. By constantly checking the availability of your websites and applications, you can quickly detect outages and minimize downtime. Maintaining high uptime is key to delivering a reliable user experience and protecting your brand reputation.
Real User Monitoring (RUM)
Real user monitoring (RUM) captures detailed data on user interactions with an application, including metrics like navigation start and speed index. User sessions, or click paths, vary widely within applications, from filling forms to uploading files. RUM tracks each action's completion time to identify patterns for
Application Performance Monitoring (APM)
Ensure optimal performance of your applications with Application Performance Monitoring (APM). APM provides end-to-end visibility into the entire application stack, from backend processing to frontend interactions. By monitoring every aspect of your application’s lifecycle, you can quickly detect and resolve issues that affect user experience and business outcomes, ensuring your applications run smoothly and efficiently.
Synthetic Monitoring
Proactively maintain high application performance with Synthetic Monitoring. This approach involves simulating user interactions from different locations and devices to continuously test your applications. By detecting issues before real users are impacted, synthetic monitoring helps ensure high availability, consistent performance, and a flawless user experience, safeguarding your brand's reputation.
Session Recording
Gain in-depth insights into user interactions with Session Recording. This tool captures and replays actual user sessions, allowing you to see exactly how users navigate through your website or application. By analyzing these recordings, you can identify usability issues, improve the user experience, and quickly resolve bugs. Session recording enhances your ability to optimize user flows and ensure customer satisfaction.